How to Use Heatmaps to Improve User Experience
Understanding Heatmaps
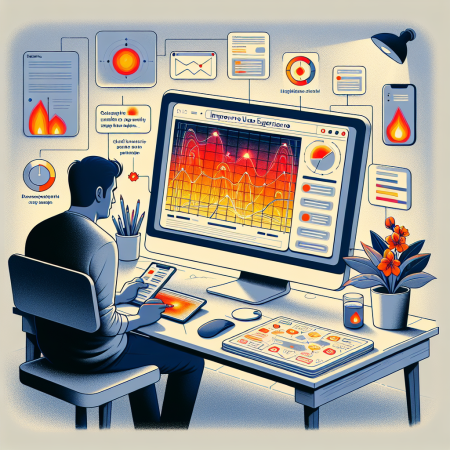
Heatmaps are graphical representations that use color coding to indicate the intensity of data values in a specific area. They provide a visual summary of information, making it easier to interpret complex data sets. In the context of user experience (UX) design, heatmaps are powerful tools for analyzing user behavior patterns on websites or applications.
Heatmaps can be categorized into different types, such as click heatmaps, move heatmaps, and scroll heatmaps. Click heatmaps show where users click the most on a webpage, move heatmaps track cursor movements, and scroll heatmaps display how far down users scroll on a page. By using heatmaps, designers and marketers can gain valuable insights into user interactions and preferences.
Benefits of Using Heatmaps
One of the key benefits of using heatmaps is that they provide visual data representation, which is easier to understand and analyze compared to raw data. Heatmaps allow designers to identify hotspots on a website where users are most engaged, helping them make informed decisions to optimize the user experience.
Heatmaps also help in identifying areas of a webpage that receive the least attention. By knowing where users are not interacting, designers can focus on improving those areas to enhance user engagement and conversion rates. Moreover, heatmaps can reveal user behavior trends over time, enabling continuous improvement of the website or application.
Types of Heatmaps
Click Heatmaps: Click heatmaps provide insights into the areas of a webpage that receive the most clicks from users. They help in understanding which elements or links are the most popular and which elements may need to be emphasized or redesigned for better engagement.
Move Heatmaps: Move heatmaps track the movement of the cursor on a webpage. They help in visualizing how users explore and navigate through the content. Designers can use move heatmaps to optimize the placement of elements for better user interaction.
Implementing Heatmaps
There are various tools available for implementing heatmaps on websites or applications, such as Hotjar, Crazy Egg, and Mouseflow. These tools offer easy integration options and provide detailed analytics to visualize user behavior. Designers can set up heatmaps for specific pages or user segments to gather relevant data for analysis.
Before implementing heatmaps, it is essential to define clear objectives and key performance indicators (KPIs) that align with the goals of the website or application. By establishing specific metrics to track, designers can effectively use heatmaps to optimize the user experience and achieve desired outcomes.
Interpreting Heatmap Data
When analyzing heatmap data, it is important to consider the context of user behavior and the design elements on the webpage. Heatmaps may reveal unexpected patterns or anomalies that require further investigation. Designers should interpret heatmap data in conjunction with other metrics, such as conversion rates and bounce rates, to gain a comprehensive understanding of user interactions.
Effective interpretation of heatmap data can lead to actionable insights for website improvements. By identifying opportunities for optimization based on heatmap analysis, designers can enhance the usability and functionality of the website, ultimately improving the overall user experience and driving business growth.
Related Content
- How To Make Your Blog a Go-To Resource in Your Industry
- Leverage collaborative challenges and contests to energize your online community
- How to Build an Online Community That Loves Your Brand
- The Power of Personal Branding in Building a Coaching Business
- The Power of Referrals for Growing Your Coaching Business Online

